Similar to my last blog entry, my efforts are still divided between two main projects;
The Going Live project has been making excellent progress. The team and I have continued improving the visual outcome of the 3D elements. With a texture in place, lighting and rendering have started to progress rapidly. Animated shots are being lit, rendered and composited, so that final testing can take place.
Although I have taken on the role of CG Supervisor, I have been involved in other areas, and responsible for others. I was involved in tracking the camera footage and creating a 3D pre-visualisation of the sequence. I have monitored the 3D pipeline continuously, and offered advice and created fixes for problems - this includes working with others in modeling, texturing, rigging, animation, and lighting. I was responsible for creating a dynamic cloth system which would allow for easier animation, and I have managed the rendering process (involving creating render layers and using the render farm). Finally, I get to pass rendered scenes to the compositing team, who can work their magic... and before I know it, we will have finished the advert!
Returning to my cell visualisation work, I have reached a temporary plateau. I have developed my pipeline/workflow and have implemented new and improved scripts to manage the new data that I have received from my colleagues in the Mathematics division.
However, the vast quantity of data has been as proving difficult to process efficiently. After some development, I have speeded up the process, but this still takes a considerable amount of time to complete. Fortunately, I discussed this with my project supervisor/programme leader, and agreed the use of high-specification computers in the University, where I can process data quickly, making use of round-the-clock facilities. This week, I will begin using these facilities, to start working with this new data that I have received.
It is important that I begin this early, as the sooner the numerical data has been translated into 3D space, the sooner I can begin developing the visual qualities of the mathematical models. Completing this visualisation process becomes even more important, as the mathematical models will be presented as part of a conference in June - giving me a deadline to work towards...

Sunday 27 March 2011
Wednesday 16 March 2011
More Data
Over the last couple of weeks, I have had to divide my attention between multiple projects.
The 'Going Live' project has ramped up into production, with modeling and rigging now complete. Animation has started, and texturing is currently underway. My role as CG Supervisor has been demanding, as all of these CG elements have been happening in quick succession. On top of this role, I was also responsible for implementing a customised nCloth dynamics system for our 'character'. This was created alongside the rigging process, to ensure that these components would work together happily, and after resolving a few technical problems, the system is now working nicely. My next task was to create and organise the appropriate render layers in Maya, ready for rendering and then compositing to take place (hopefully late this week or early next). Although I had worked with render layers before, this project requires more variants than I am used to working with, so has taken a bit of time to configure and setup properly. Despite all this work taking up more time than initially expected, the project has made good progress, and continues to do so.
After my meeting with mathematics last week (and several more since), my cell visualisation workload has increased also. I have received new data from both students, and I am currently in the process of writing scripts that will translate these into 3D scenes inside Maya.
The first new data set contains fibres (to be added to cells), which are based on xyz locations and xy rotations. I had not scripted rotation values yet, so this was a good opportunity to expand my knowledge of MEL. I am currently awaiting the full data-set for this part of the visualisation, so will continue to work on this moving forwards.
The other data set adds oxygen density to a scene containing cancer cells and blood vessels. This file contains over 30 million lines of information, and weighs in at around 800mb - making it rather difficult to work with. I have tried different approaches in visualising this data efficiently, such as adjusting transparency on cubes based on the density value or scaling particle clouds. Unfortunately, there are about 10,200 points per frame, so these methods take far too long to calculate. I am currently testing a new method, which creates a single polygonal plane, with the required number of vertices. The script then runs through each vertice, and moves it in the y-axis based on the density value (between 0 and 1). A ramp shader then adjusts the transparency of the plane based on the height (where 0 density is fully transparent). This creates white, cloudy patches where oxygen density is high. Although this still takes a long time to process, it is considerably faster than the other methods.
Most of this work is still on-going, and has 'arrived' at the same time, making it difficult to balance. Fortunately, I have been able to allow extra time in working on these projects, so hopefully the worst of it is over now...
On a more exciting note, three of my videos were used at an event in Dundee on Saturday 12th March. The videos are 3D visualisations of mathematical models which are being used to predict cancer growth and development, and were developed in collabroation with a PhD student in the University's mathematics division. They were shown at an event called "Sensational Women in Science" as part of the Women in Science Festival 2011.
Also, some of the other data I am currently working with will be presented at a large conference later this year (in June), so I have a deadline which I can work towards.
Tuesday 1 March 2011
Snake In The Grass
...more specifically, a Python.
Continuing on from my Cinema 4D experimentation with metaballs, I abandoned that line of testing, as it wasn't going to be a viable option for the large amount of cells I was dealing with. Alongside Digital Tutors, I returned to Python scripting, trying to 'translate' my MEL script into something useable inside of Houdini.
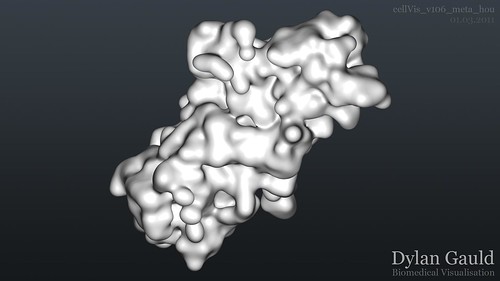
After almost a week's worth of scripting, fixing things, and re-scripting, the Python/Houdini version of my data-loading script works, creating all of the necessary nodes in Houdini, and keyframing all of the animation. This allowed me to natively create metaballs, rather than try and convert existing scene information. Houdini handles metaballs exceptionally well, adjusting the viewport geometry on the fly (so it doesnt crash regularly like Cinema 4D). Using Mantra, I was able to render out the full 1900 frame image sequence, with frame 1900 shown below;
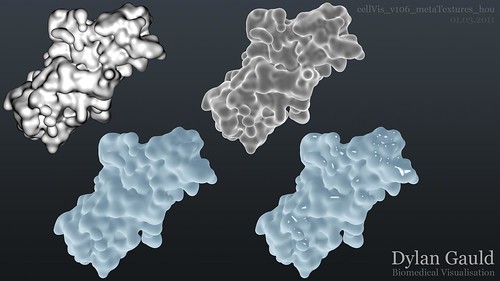
Although I am still learning to use Houdini, I have made breakthrough progress in using the software alongside Python, opening up a whole range of new opportunities. I have started trying to figure out shaders and lighting in Houdini (which seems more difficult than expected), and I created some example 'looks' for my meta-surface, shown below;
I am due to meet with the mathematics department this week, where I will present all of my research, ideas, and generated media - bearing in mind, that they have not seen any of the results so far. I am hoping that this meeting will help inform my next steps, and direct my technical understanding to a new visual solution.
Subscribe to:
Posts (Atom)