My programme of study takes a more visualisation based route, and I am working with the University mathematics division to visualise numerical data (gained from their mathematical models) which represents the growth and development of cancer cells (or solid tumour growth).
Working with numerical data has created it's own set of challenges, as Maya cannot read or interpret this in it's off-the-shelf form. As a result of this problem, I have developed skills in using Maya's own scripting language, MEL (Maya Embedded Language) and also a second scripting language (used more widely) called Python. Although this has been a difficult and time-consuming process (several months of learning, which is still ongoing) I have been able to harness this new understanding and create custom tools which can be used to read the mathematical data and create appropriate 3D geometry.
Throughout learning each scripting language, I referred primarily to online sources, and the 'official' documentation provided. I also used the Digital Tutors service, which was both informative and relevant, helping me overcome the hurdle of knowing where to start, and what to focus on.
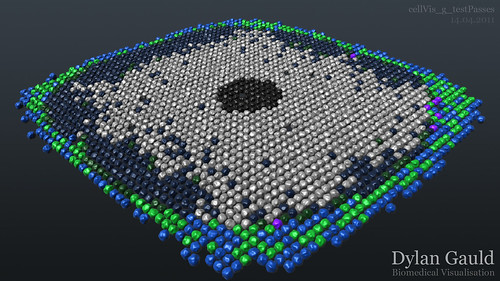
Through creating my own custom tools, I was able to work with the numerical data-sets provided. Starting with simple tests, I was (eventually) able to construct fully animated scenes containing simple spheres, representing the individual cancer cells, and although time-consuming to process, these results opened the way for more advanced development of the data and it's visual attributes.
I spent some time experimenting with Maya's render layers, and compositing passes using Nuke. This was as a response to feedback given last semester - not everything has to be done in 3D, as it can often be quicker and easier to complete some work in 3D, but fine-tune the details in post-production. This helped me develop possible ideas for the look of cells, when considering texture on a microscopic basis, and I also experimented with 'faking' depth-of-field techniques to enhance this.
Although creating spheres was great, I wanted to push my skills further. I spent time working with RealFlow, Cinema 4D and Houdini - three great 3D packages. With the exception of RealFlow, these were entirely new to me, and although Cinema 4D was fairly straight-forward, Houdini had a very steep learning curve. Using my Python scripting skills, I created a large-scale metaball system, equivalent to the spheres created in Maya - this was a challenging task, forcing me to solve several problems, whilst trying to script in a language mostly new to myself. The result of this technical experimentation allowed me to create an interesting almost-organic 3D structure, which moved and behaved as one surface, instead of 1068 individual cells.
After completing these Python related tasks, I returned to Maya to work with additional data-sets, still showing the growth and development of cancer cells, but in a different format. This data would require not only animated movement of cells, but changing colours, and eventually, complex density 'clouds'.
The difficulty at this stage in my work, was the size of the data-sets... one of which contains over 30 million lines of information (a text file weighing in at around 800mb). Despite breaking this into smaller chunks of data, it was still computationally intense, and difficult to work with (often crashing high speed computers). I spent time streamlining and optimising my scripts, and the way they handled the data - as an example, my oxygen density script was originally taking around 350 seconds per frame to process, whereas now it takes around 90 seconds, about a quarter of the time. As I have learned more about MEL, and gained a better understanding of the language, I have been constantly improving and refining my scripts, to ensure the best efficiency when working with large data sets.
I am currently working with new additional data-sets, which again have constantly required me to think and problem solve... now that my scripts are optimised, I am confident that my scripting abilities are suited to a wide range of data types, across two very different scripting languages. This allows me to tackle upcoming problems with new knowledge, based on the experiences I have had over the last ~3 months, giving me a definite headstart.
In summary, my practice-based learning has developed the following;
- Scripting - both MEL and Python, for simple and complex tasks (including 3D visualisation)
- Improved software knowledge - Maya, RealFlow, Nuke
- New software knowledge - Cinema 4D, Houdini
- Advanced 3D skills development - particles/dynamics, data input/output, script optimisation, rendering
- Experience in 2D compositing with 3D-based image sequences
Due to the sensitive nature of the mathematical data I am working with (and as the source data is effectively the result of unpublished research) I am unable to post a large amount of my visual work online. However, this sensitive material will be made privately available during course presentations, and to module assessors as necessary.